BTC-USD LIVE PRICE
MIXED
—
VOLATILITY PRESSURE: —
NEXT HOUR · UP
—
—
—
NEXT HOUR · DOWN
—
—
—
NEXT DAY · UP
—
—
—
NEXT DAY · DOWN
—
—
—
ETH-USD LIVE PRICE
MIXED
—
VOLATILITY PRESSURE: —
NEXT HOUR · UP
—
—
—
NEXT HOUR · DOWN
—
—
—
NEXT DAY · UP
—
—
—
NEXT DAY · DOWN
—
—
—
FEATURE BARS
—
1-SEC WINDOWS
LABEL RATE
—
τ = 75TH PCT
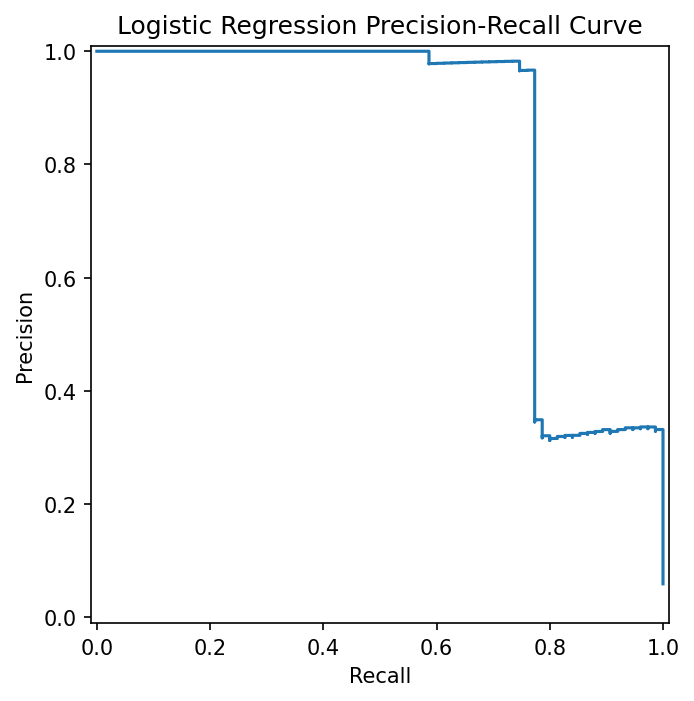
PR-AUC · LOGISTIC
—
VS BASELINE 0.826
F1 @ THRESHOLD
—
VAL-SELECTED THR
TRAIN / VAL / TEST
—
60 / 20 / 20 %
VOLATILITY TIMELINE
LEFT: absolute price (USD) · RIGHT: realized_vol_60s ×10⁻⁴ · ORANGE DOTS = model spike flags · tabs switch pair
━ PRICE (LEFT AXIS, USD)
╌ VOL ×10⁻⁴ (RIGHT AXIS)
● SPIKE (MODEL FLAG)
BASELINE · Z-SCORE
REFERENCEPR-AUC
—
F1 SCORE
—
POSITIVE RATE
—
Single-feature z-score on normalized volatility. Threshold selected on validation F1.
Sensitive to non-stationarity in reference window.
LOGISTIC REGRESSION
WINNER ↑PR-AUC
—
F1 SCORE
—
POSITIVE RATE
—
StandardScaler + LogisticRegression (liblinear, balanced). Jointly weights
spread_bps + realized_vol_60s + ewma_abs_return. Train time: <10ms.
LOGISTIC vs BASELINE — IMPROVEMENT
PR-AUC DELTA
—
F1 DELTA
—
SPIKE RADAR
Orange-dot events from the model. In live mode, this panel updates the moment a new spike is flagged.
Orange dots mean the model thinks the next minute is unusually likely to become turbulent. They do not mean price must go up or down.
WHAT THIS MEANS NEXT
Simple turbulence probabilities for a non-technical reader. Think of it as the live odds of a yes-or-no question: “Will the market get rougher from here?”
NEXT MINUTE
—
— calmer
NEXT HOUR
—
— calmer
NEXT DAY
—
— calmer
Load exported or live data to view the simple turbulence outlook. Higher percentages mean rougher conditions are becoming more likely; lower percentages mean the market is cooling down.
RECENT PREDICTIONS
TEST-SET SAMPLE · LAST 20 ROWS| TIME | PAIR | TRUE | PRED | PROB |
|---|
METHODS
01
COINBASE WEBSOCKET → KAFKA (ticks.raw) → FEATURE STORE (ticks.features)
02
1-SEC OHLCV BARS · 11 FEATURES · TAU = 75TH PCT (7.83×10⁻⁵)
03
TRAIN/VAL/TEST = 60/20/20 % (CHRONOLOGICAL SPLIT)
04
BASELINE Z-SCORE · LOGISTIC REGRESSION · MLFLOW TRACKING
05
EVIDENTLY DRIFT REPORT · FEATURE DISTRIBUTION SHIFT DETECTED (CALM CLOSE)
06
VOL AUTOCORR r=0.991 (realized_vol_60s ↔ sigma_future_60s) — PERSISTENCE, NOT LEAKAGE